Thursday, June 23, 2011

How Bad Are The 2011 Royals Starters?

Going by the things pitchers have the most control over (strikeouts, walks, hit-by-pitches and homers) the 2011 Royals starting pitching is on its way to being the second worst in franchise history, right up there with the dismal 2005-06 seasons. Here is a look at the best and worst starting pitching performances in franchise history by FIP- (lower is better):

source: Fangraphs

Thursday, June 16, 2011

Escobar's Hot Streak Visualized

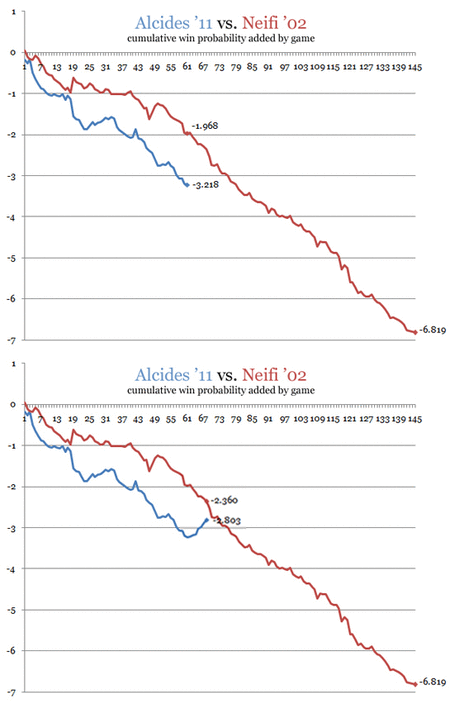
Ever since my previous post about Alcides Escobar's historically awful start as measured by win probability added (WPA), he has gone on a hitting tear. In the last seven games, he is 14-for-25 with a walk and a line of .560/.577/.760. He has had a positive WPA in each game, and that game-by-game graph I posted comparing him to Neifi Perez's modern record for worst WPA season looks a whole lot better after Esco's hot week:

through 61 games compared to 68 games
Esco obviously won't be able to keep up this pace, but if he has come out of his terrible early season slump and can hit just a little, the Royals have a very special shortstop on their hands.

Wednesday, June 8, 2011

Escobar Entering Scary Bad Hitting Territory


Alcides Escobar's complete lack of hitting has been monstrously hurtful to the Royals chances of winning games. Neifi Perez's record -6.8 win probability added (WPA) in 2002 (worst in MLB since 1950, which is as far back as Baseball-Reference's WPA goes) is in jeopardy. After 61 games this year, Escobar is already down to a -3.2; after the same number of games in 2002, Perez was "only" at -2.0. At Escobar's current pace, he would finish the year with an unthinkable -8.5.

If the season ended today, Escobar would already own the fourth worst WPA in Royals history:

Rk Player WPA PA Year OPS+
1 Neifi Perez -6.819 585 2002 44
2 Angel Berroa -3.448 503 2006 52
3 Angel Salazar -3.437 332 1987 23
4 Alcides Escobar -3.218 234 2011 38
5 Greg Gagne -2.923 581 1993 89
6 Tony Pena -2.902 536 2007 68
7 Jason Kendall -2.832 490 2010 71
8 Cookie Rojas -2.828 409 197073
9 John Buck -2.818 430 2005 79
10 David Howard -2.805 485 199652
Provided by Baseball-Reference.com: View Play Index Tool Used Generated 6/8/2011

The question that has to be answered is how much Escobar has to hit to justify keeping him in the lineup long-term. I don't have an exact answer for that, but I do feel sure he has to do better than this. I'm all for continuing to play him everyday for the rest of the year in the hopes the bat comes around just the slightest, because his defense is a marvel. But so far, that glove is paired with one of the most detrimental bats in history.

Sunday, May 29, 2011

Tim Collins And The Disappearing Strikes


Tim Collins was an exciting prospect mostly due to his excellent walk and strikeout totals in the minors. In 2010 (with three different teams) he had four strikeouts for every walk. Through his first six big league appearances, he showed that control with 10 strikeouts to three walks. Ned Yost has shown supreme confidence in Collins, calling on him in over half of the team's games so far. His 28 appearances lead the American League. Unfortunately, his trademark control is deserting him, which may or may not be due to overwork. His K/BB rate is way down to 1.29. It seems clear that Yost needs to back off Collins in the hopes his control will return. Yost bringing Collins in yesterday for seven outs when the Royals were trailing by 10 runs was bewildering.

He has now thrown strikes at a rate of just 58%, well below the AL average of 63%, and the worst among Royals pitchers on the active roster. He has remained mostly effective as teams have not been hitting him hard, but it may only be a matter of time before the increase in walks and decrease in strikeouts comes back to bite him and his team. With an eight man bullpen, there is no excuse to continue riding Collins so hard.

Royals pitchers with at least 150 pitches through May 28
Jeremy Jeffress was sent to Omaha to work on command, but even he was throwing more strikes than Collins. Collins has earned more leeway since he has shown great control in the minors, and I am not in favor of demoting Collins. Just give the guy a little rest.

Friday, May 27, 2011

David DeJesus: 2nd Best Outfielder On Most Playoff Teams, 4th On None

Robert Ford of 610 AM is becoming my blogging muse. After he opined that Kevin Appier was not an ace, I dug through Appier's career to show that he clearly was. Now he has tweeted that David DeJesus "would be a 4th OF on most contending teams."


This is not the first time Ford has said as much. Clark Fosler refuted the same claim by Ford a year ago on Royals Authority. With DeJesus long gone from KC and off to a poor start in Oakland, this topic is anything but timely for Royals fans, but Ford's comment still rankled me. We have had so few good players in recent Royals history that I hate to see one of them so under appreciated.

I have looked at the outfielders of the 24 AL playoff teams between 2005-10 to see where DeJesus would have fit on each team by Baseball-Reference Wins Above Replacement. And while I knew DeJesus was no fourth outfielder, he comes out looking even better than I expected.  Not a single AL playoff team had three outfielders with a higher WAR than DeJesus in the last six seasons. He would have been the best outfielder (by WAR) on eight of the 24 playoff teams during that stretch, or one in three. On average, he would have been the second best outfielder on those teams.

Ford argued further on Twitter that DeJesus does not have the power that teams covet in their corner outfielders, which may be true, but playoff teams have not been able to do any better than the fantastically under-loved David DeJesus. I did not like the Royals trading him to Oakland when it happened, and I like it even less now.

After the jump, you can see where DeJesus would have ranked in all of the AL playoff outfields over the last six seasons.