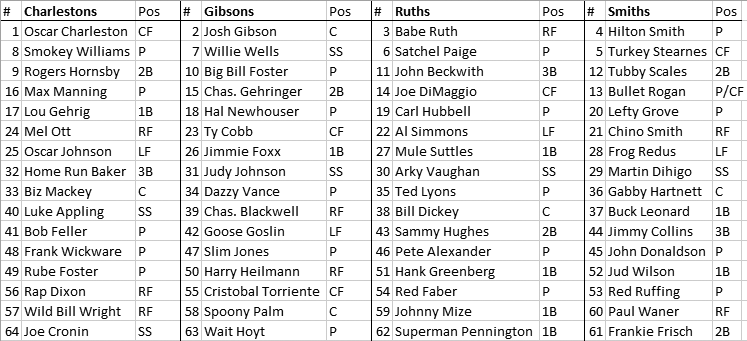
My dad played some Strat-O-Matic baseball as a kid, but he never did introduce it to my brothers or me for some reason. I'd been mildly curious about Strat for awhile, but when they released a set of Negro Leagues All-Stars back in 2009, I had to check it out. I ordered the board game, the Negro leagues card set, and a set of Hall of Famers. My then three year-old son was interested in rolling the dice for me for a little while, and I enjoyed getting to put some of the Negro leagues legends into action as I learned the basic game. The game went on the shelf for awhile, with the hope that my son would get into the gameplay more when he was a little older. We pulled it down last fall, and six year-old Henry was indeed a little more into it, and can find the results of each dice roll on the cards by himself now. My interest in the game was re-piqued, and I started getting curious about learning the advanced version of the game. So I decided to draft four teams made up of Negro leaguers and pre-integration Hall of Famers to learn with. The first step was choosing the pool of players. I decided to make the "league" split evenly between Negro leaguers and Hall of Famers, so chose the top two players at each position from each set, plus some extra pitchers and bench players, and went about drafting four teams. For the draft, I ignored which set the player came from, and ended up with what four all-star teams might have looked like between roughly 1900-1946 had the insanity of segregation not existed. Here's how the four teams (which I named for their respective first picks) shaped up (click to enlarge):
Much to the chagrin of my wife, I started rolling some games ("Why would you want to play by yourself?!") to try out some of the advanced rules. But then I started getting a little too into the results and how these players were performing against each other. In the tiniest of ways, it feels like righting the wrong of separating the best players from each other during their era. Next thing I knew, I had dreams of playing a full 154 game season for each team (a total of 308 games), partly for the fun of just playing the game, and partly to come up with some oh so satisfying stats from these guys playing together. It's a great way to fill the baseball void in the off-season. I'm about a quarter of the way there, and just took a long time tabulating the stats from the season so far, and figured I might as well share them here in case anyone else finds it enjoyable. (After I explained what I was doing, even my wife allowed she could see how it might be compelling to integrate the segregated era.)
The team results aren't particularly interesting since they are arbitrary teams, but so far, it seems I picked evenly. Here are the wins and losses:
Charlestons 21-18
Gibsons 20-19
Smiths 19-20
Ruths 18-21
More fun to me are the individual leaderboards. The league has been extremely high scoring, with teams each scoring around six runs a game. The average ERA is 5.21 and average OPS is .826. Without further ado:
Much to the chagrin of my wife, I started rolling some games ("Why would you want to play by yourself?!") to try out some of the advanced rules. But then I started getting a little too into the results and how these players were performing against each other. In the tiniest of ways, it feels like righting the wrong of separating the best players from each other during their era. Next thing I knew, I had dreams of playing a full 154 game season for each team (a total of 308 games), partly for the fun of just playing the game, and partly to come up with some oh so satisfying stats from these guys playing together. It's a great way to fill the baseball void in the off-season. I'm about a quarter of the way there, and just took a long time tabulating the stats from the season so far, and figured I might as well share them here in case anyone else finds it enjoyable. (After I explained what I was doing, even my wife allowed she could see how it might be compelling to integrate the segregated era.)
The team results aren't particularly interesting since they are arbitrary teams, but so far, it seems I picked evenly. Here are the wins and losses:
Charlestons 21-18
Gibsons 20-19
Smiths 19-20
Ruths 18-21
More fun to me are the individual leaderboards. The league has been extremely high scoring, with teams each scoring around six runs a game. The average ERA is 5.21 and average OPS is .826. Without further ado: